
On October 28, 2020, ZEAL Co., Ltd. held " [Webinar] Changing the Common Sense of Data Utilization with Tableau and Snowflake-Creating a Dashboard That Moves Lightly from 150 Million Sales Data- " it was done. report its contents.
Introduction
In order to analyze and utilize data freely, analysis tools that are easy for users to use are necessary. But that alone is not enough to analyze the data. It is necessary to prepare the data itself in a place freed from various restrictions. In this seminar, we will introduce "Tableau" and "Snowflake" as products that remove that constraint. "Tableau" is a BI tool that allows anyone to easily analyze any data, and " Snowflake " is a cloud-based data warehouse (DWH) service. And we will introduce the merits of this combination from Zeal, which has a proven track record of introduction to customers.
Part 1 Demonstration of data utilization issues up to now and future data utilization scenes
<Lecturer> Ms. Mika Kamei, Business Development Department, ZEAL Co., Ltd. | Mr. Shinichi Okamoto
Data utilization and issues to date
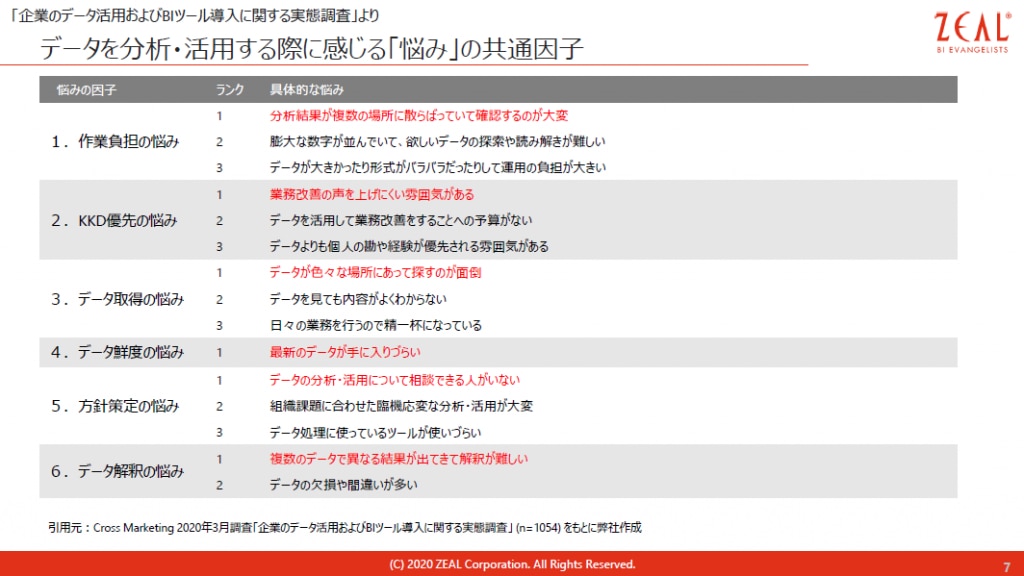
When we conducted a questionnaire with our customers about issues with data utilization, we received responses such as, "I don't know how to proceed with data integration because the data is scattered," and "I want to start using data, but I don't know how to proceed." There were many answers saying no.

In addition, I often hear that there is no one to consult about data analysis and utilization, or that different results are obtained from multiple data and interpretation is difficult.
We believe that the combination of Tableau and Snowflake solves these challenges .
Tableau is a visual analytics platform that makes powerful analytics accessible to anyone with intuitive controls. One of Tableau's strengths is that you can easily find friends and talk to them, because the community is enriched even when you have trouble using the product or you don't have anyone to talk to.

Snowflake is a next-generation, fully managed, cloud-native data warehouse.
It supports multiple cloud services and is characterized by the separation of storage and computer resources. With traditional data warehouses, intensive processing slows overall performance, but Snowflake dynamically allocates the necessary resources when processing is intensive, so you don't have to worry about performance. can be used without

Snowflake dataware size allocation screen
Since it is possible to change the server size according to the application and autoscale to automatically increase or decrease the number of clusters to be used according to the multiplicity of processing, as shown by the red line in the figure below, the conventional system in which resources are always started in advance You can stop using molds and realize analysis and data utilization using always fresh data in a cost-optimized environment.

If you collect data in Snowflake, you can access it with good performance, so you don't need to "search for distributed data", which was the problem of data utilization that I talked about at the beginning, and you can create a physical mart to improve performance. becomes unnecessary. And with Tableau, you can analyze and visualize with simple operations, and you can share dashboards, so you can quickly find the answers you want to know. Both Tableau and Snowflake do not incur high license fees from the beginning, so you can start small, so if you are worried about where to start, start small with these two solutions. Why don't you take a look?
A free trial of Snowflake is available here. You can try it now for free for 30 days. Please apply from
the link below.

Part 2 True data utilization realized by combining BI (Tableau) / AI (Einstein Analytics)
<Lecturer> Tableau Software, LLC Partner Account Manager Kei Kuroi
At the Tableau Conference held for three days from October 7th, it was announced that "Einstein Analytics" will be rebranded as Tableau CRM. I will introduce this content and new suggestions obtained by combining Tableau and Snowflake, and what this is.
1. Why is cross-organizational data utilization difficult?
There is a famous report by the Ministry of Economy, Trade and Industry called the 2025 Cliff, which explains why data utilization is not progressing. This is because existing systems are built for each business division and cannot be used across the company.
Also, data utilization does not go well just by visualizing the data. More importantly, how about changing the process of using data in Tableau? I have a proposal.
In the conventional data utilization process, data is extracted from core systems, etc. to create materials, but the freshness of the data begins to decline from the point of extraction. For this reason, when you want to change or modify it, you cannot immediately modify it, making it difficult to make decisions based on the latest and correct information.
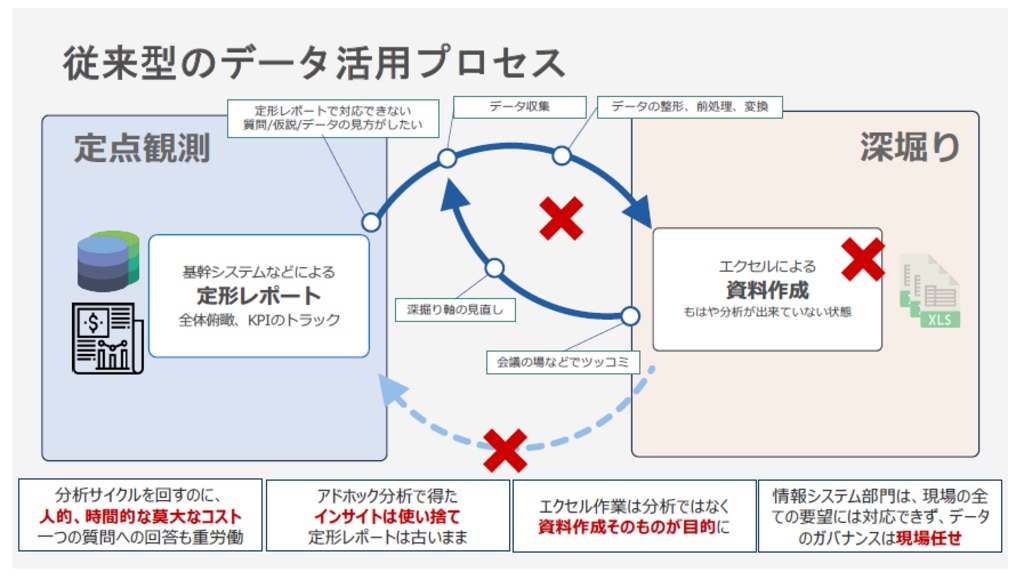
With Tableau, by connecting directly to data sources such as mission-critical systems, the cycle of seeing data and turning it into action becomes much faster. We believe that changing the data utilization process as shown in the diagram below will enable us to overcome organizational barriers.

2. How to get insights from business systems
Tableau was acquired by Salesforce last year. At Salesforce, we have a vision of “Customer360”. This is a mechanism that supports the digital transformation of our customers. Our vision is to cover the customer's issues with various technologies, see the customer in a centralized manner, and make optimal proposals.
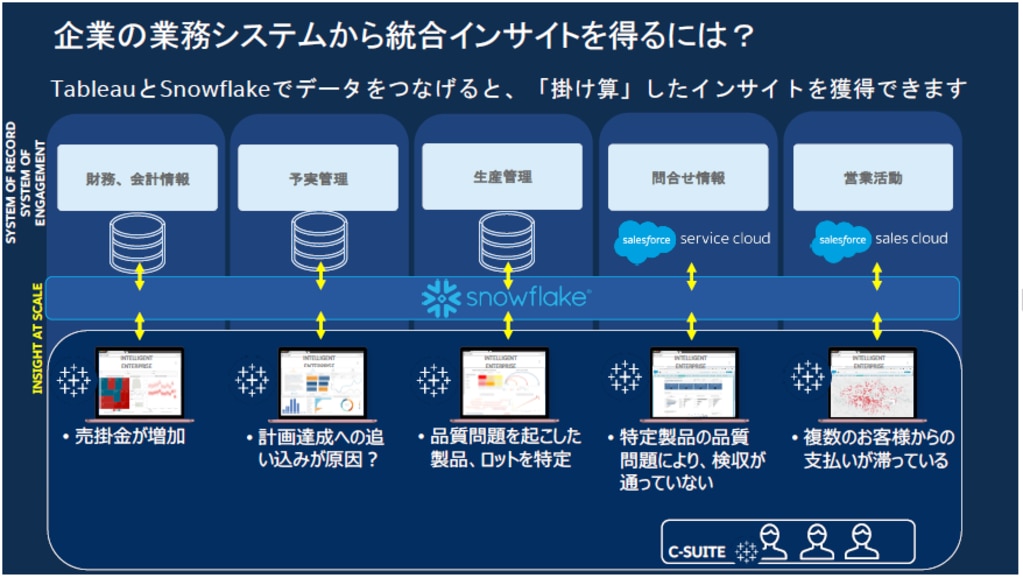
The chart below lists five typical in-house systems. From left to right, we have an accounting system, a budget management system, a production management system, a system that manages inquiry information, and a customer management system that manages sales activity information.
Usually, each in-house system has a mechanism to visualize data. Using this, you can grasp the data closed to each system, but you cannot multiply it with the data of other systems. For this reason, management can refer to what is exported to a CSV file, aggregated with spreadsheet software, or visualized with Tableau.
However, for the same reason as above, the exported file is not fresh. It's not up to date.
The recommended way to solve this is to aggregate the data in Snowflake and analyze it in Tableau.

For example, if you find that your accounts receivable has increased in your accounting system and you are unable to collect it, you have to find out what the problem is. If you look at SalesCloud , which manages sales activities, you can see that several customers are behind on payments. To find out more, let's take a look at ServiceCloud , which manages contact information . When I checked, I found that there was a problem with a specific product, and there was a case where the acceptance inspection was not done. Since there is a problem with quality, I will check the production control system . Then, we were able to identify the part or lot that caused the quality problem. The next thing to check is the budget and actual management system . It is hypothesized that the quality problem may have arisen from the pressure on the planned value.
By connecting business systems with Tableau and Snowflake in this way, it is possible to obtain insights by cross-cutting various data.
3. Data value chain created with Tableau + Snowflake
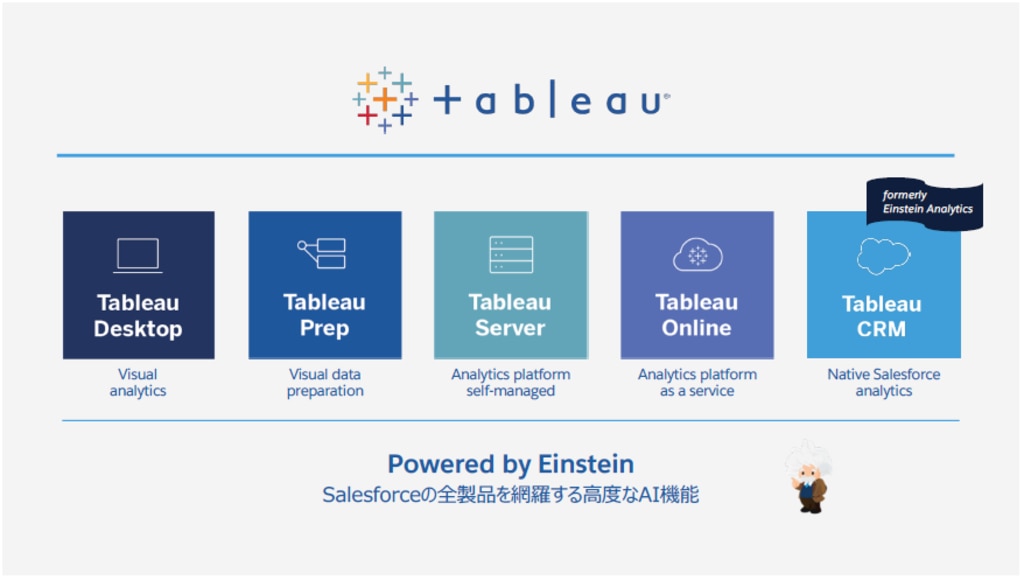
The figure below shows Tableau's new lineup.
"Einstein Analytics" becomes Tableau CRM.
I think there are people who have been using it for a long time, but you can use it with confidence because the function and price will not change just by changing the brand.
It also describes each of Tableau's products.
Tableau Prep Builder: Connect to various data sources and perform data cleansing (processing, shaping).
Tableau Desktop: Connect to your data and gain insights through visual analytics.
Tableau Server / Online: Share the obtained insights with your team, report to your boss, and send them to other departments.
Tableau Catalog: Catalog data assets under Tableau management. Search, management, and provenance management become easier.
Tableau Prep Conductor: Automate procedures (flows) in Tableau Prep Builder.

“Einstein Analytics” and Tableau are separate products, but we plan to integrate them in the future. First, we will integrate and link from the AI/ML and data layers.

Finally, a roadmap was announced to integrate at all layers.
Now, as a concrete image of the integration of AI/ML and data layers, I will list the following three functions.
- Dashboard Extensions: Access real-time forecast results from your dashboard
- Analytic Computing: Embed real-time predictions into your viz
- Tableau Prep: Add predictive numbers to dataset
I will explain each one.
Dashboard Extensions: Access real-time forecast results from your dashboard
The left side of the figure below is the Tableau dashboard, and the right side is Einstein.
31% is written on the right side, which indicates the possibility of shipping delays. What factors accelerate shipments? That's what it says. In this way, the results of Einstein's analysis of various forecast data are displayed, so you can quickly take the next step.

Analytics Calc: Embed real-time predictions into your viz
There is a scatter plot in the lower right of the figure below, but Tableau CRM is displayed with a calculation formula from a Tableau worksheet. Currently, there is a mechanism to call external functions such as Python and R, but the same mechanism is implemented.
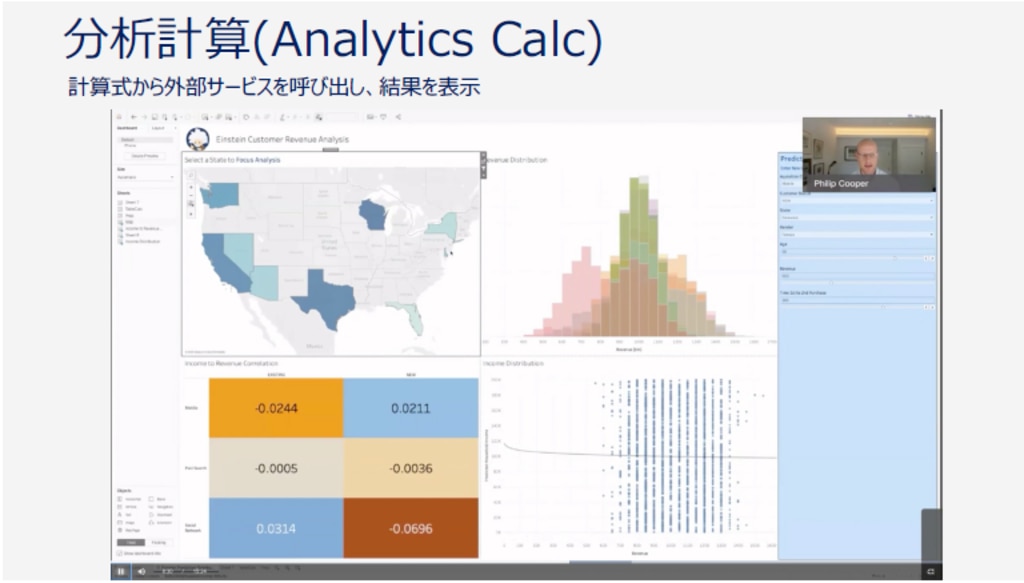
Tableau Prep: Add predictive numbers to dataset
Tableau Prep flows will now have the ability to pass data to predictive models and get results back. You can select a prediction model that has been created in advance, so you can prepare data that incorporates the results of the prediction model without knowing the details of the prediction model.

The more predictable you are, the easier it is to respond to change. Now let me show you how to do it next.

Connect Desktop and Prep to Snowflake to clean up your data. Then pass it to Tableau CRM to create forecast data. When you upload data with forecast data to Tableau Online, here you have a dataset of historical and future data. Analysts can analyze it with Tableau Desktop, people in the field can connect to Tableau Online, and in some cases Salesforce can be embedded in the customer's portal so that portal users can indirectly The scenario is to see the data online. The data set behind it is Snowflake, which collects data from SAP, Anaplan, and others. By doing this, you can see the data used in various tasks side by side.
Anyone with Tableau Creator, Tableau CRM and Snowflake can get started, so please give it a try.
Part 3: Reduce data waiting time to 0 - Data Cloud, a platform that does not stop the flow of analysis
<Lecturer> Mr. KT, Senior Sales Engineer, Snowflake Co., Ltd.
The third part is a Snowflake session. We will introduce what Snowflake can do and what it is aimed at in this market.
Tableau was introduced in the previous session, and I was a Tableau employee until May 2020. I will introduce the diagram of [visual analysis cycle] that illustrates the steps of "Do you understand?". It is a simple diagram showing how people use data.

There are various tasks, such as wanting to use data to improve sales and profits, and wanting to reduce costs. In order to solve the task, think about what kind of data to acquire and what kind of graph to express, and finally share it with someone to encourage action. Each of these operations should not take time and be slow. Waiting time interrupts our flow of thought. Therefore, it is very important to be able to quickly perform each step without waiting.
In the world that suddenly changed one day, I noticed something
Due to the spread of the new coronavirus infection, Japan declared a state of emergency in April 2020, forcing many people to stay at home. Lockdown measures were taken around the world, and people around the world were greatly restricted from going out. However, if you stay at home, you won't be able to see what's going on outside, and you won't feel that the infection is spreading. So what should we do? To find the answer, we tried to unlock the invisible using data. Tableau Public has many volunteers posting reports related to the coronavirus. Many people around the world have been making efforts to see if they can do something about this situation, or if we can do something about it with our own strength. However, on the other hand, behind these easy-to-understand visualizations, there was a steady and persevering effort that was not visible on the surface.

The method of collecting data on people infected with the coronavirus can change suddenly, so I had to tweak it almost every day to collect it. The public health center does not originally work to digitize the information of infected people. How different things would have been if the data had been recorded automatically. Unfortunately, a significant amount was manually aggregated and submitted. As a result, they must have put pressure on their original work of inspection. The act of collecting data itself got in the way of the work that should have been done.
Therefore, if we were to ask whether it was possible to use data to learn about various things in our world, it was still a long way from data = the world. In terms of Tableau, there was no data to get. Bringing in and retrieving data is very easy. However, I noticed a big problem that the data I wanted to collect did not exist in the first place.
Our Mission: Enable every organization to be data-driven
We just exist, and we generate data on a daily basis as long as we live.
When you browse websites, log in to systems, write on social media such as Facebook and click "Like", send out surveys, etc., they operate without being aware that they are generating data. As long as we are alive, we generate a variety of data. Many people are unaware of how the data is used. Data that goes unnoticed even when it is created is stored by a very small number of companies that are well versed in data without even noticing it. We must be conscious that the data we generate is ours. The world is now at a crossroads. Organizations and individuals who can manage and utilize their own data by themselves, respect the will and dignity of data owners, and ethically increase business value are advancing data-driven worldwide. Or, the data is exploited by an organization that is good at handling extremely limited data, and those who belong to other organizations cannot use the data by themselves, and only a limited number of people can benefit from the data. It is a big turning point as to whether we will rush into a disparate society that receives
I believe that there are various possibilities for using data for all organizations. We want to create a place where everyone can use data, not data for just a few. The reason this is not the case now is because it is too difficult to leverage the data. That 's why we built Snowflake to make it easy for anyone to work with data to make every organization data-driven.
The data cloud that powers every organization
We provide a data cloud that every organization can use. This is a place that can cover any situation, whether the data is clean or unorganized, whether the amount is large, or how many people are using it. If everyone's data can be collected in one place in the data cloud and maintenance can be reduced to the limit, data management will become much easier. We aim to create a world where people can collaborate together without worrying about managing data.
In the first place, why can't we use data when we want to? It has three challenges:
Three major issues
1. Origin
of data If the place where the data is born is different, the shape and amount will be different, and the ability and ingenuity to quickly process it are required.
2. Siled
Data is easy to silo because the place where it is generated is different in the first place. In addition, even after data is integrated once, there are cases where data marts are created for performance reasons and silos are promoted again.
3. Shared hurdles When sharing
data with other organizations, it is necessary to duplicate and send the data. When data that should have been protected once is sent to another location again, security settings for data storage locations and communication methods must be reconsidered. Transmission of heavy data and linking data with high update frequency are costly.
It used to be thought that a huge amount of hardware resources would suffice in order to flexibly process data scattered all over the place. Therefore, it was thought that the above problems would be solved by the cloud, which can be used instantly even with huge resources. But it didn't work. This is because there were only two existing clouds:
・Application cloud
For example, sales force.
・Infrastructure cloud
Examples include AWS and Azure.
After all, it is difficult to see data in the current cloud environment alone. Viewing the data involves a complex step of integrating and calculating the data generated by the application. We raised the issue that simply having a processing location in the cloud environment would not allow efficient use of cloud resources. We want to make this complexity as easy and simple as possible. We aim for a data cloud that exists like a cushion between the application cloud and the infrastructure cloud so that anyone can use the data anywhere. To that end, we believe it is extremely important to be multi-cloud and multi-region so that data can be stored wherever it is.

Architecture supporting the data cloud
Storage is integrated in one place, and computer resources can be individually attached to it. You can create any number of computer resources that access the stored data. Nevertheless, Snowflake's architecture is such that no matter how many computer resources access the data in one place at the same time, there is no conflict.

It can handle even when the amount of data is small at first and increases steadily along the way. As you increase the warehouse size, the processing time gets shorter and shorter. The cost is the operating time times the performance. For example, if the processing that takes 16 minutes for XS size can be processed in 1 minute for XL size, the amount will be the same. If you can get 1/16 speed for the same amount of money, you should choose the faster one.
Snowflake is normally protected by security, but it is also possible to make a part of the data public, or to lend this data only to a certain person. You can keep your data in one place and not copy it anywhere, and another user can access your data using their own warehouse. This is the data sharing function. There is also a data marketplace that utilizes this feature to allow data providers to display their data in the marketplace. Real-time information on the new coronavirus is released free of charge on the data marketplace and is used by research institutions, medical, pharmaceutical industries, and governments around the world. It is an epoch-making data sharing method that can be realized because it does not matter how many warehouses are accessed.
These functions and vision have been highly evaluated, and more than 3,000 customers are currently using Snowflake as their data infrastructure.
We would like to walk together with you on the path to create an environment where each individual can come up with the most creative ideas and all organizations will become a data-driven world.
summary
We often hear the term self-service BI, and the product that has driven self-service BI is probably Tableau. Also, the best place to store data is Snowflake, which is cloud-based and crosses vendor boundaries. It's the perfect combination of products that you need to make the most of your data. Let's start data-driven management from a small scale by combining both products. If you are interested, please contact us here.

TableauとSnowflakeでデータ活用の常識を変える
~1億5000万件の販売実績データから軽快に動くダッシュボードを作成~
2020年10月28日、株式会社ジールにて、『【ウェブセミナー】TableauとSnowflakeでデータ活用の常識を変える~1億5000万件の販売実績データから軽快に動くダッシュボードを作成~』が開催されました。その内容をレポートします。
はじめに
データを自由に分析し活用するためには、ユーザーが利用しやすい分析ツールが必要です。しかし、それだけではデータを分析することはできません。データ自体をいろいろな制約から取り払った場所に用意しておくことが必要となります。本セミナーでは、その制約を取り払う製品として、「Tableau」と「Snowflake」をご紹介します。「Tableau」は、データを誰もが簡単にあらゆるデータを分析できるBIツール、「Snowflake」はクラウドベースのデータウェアハウス(DWH)サービスです。そしてお客様に導入実績のあるジールからこの組み合わせのメリットについてご紹介します。
第一部 今までのデータ活用の課題とこれからのデータ活用シーンを実演
<講師> 株式会社ジール ビジネスディベロップメント部 亀井 美佳 氏|岡本 真一 氏
これまでのデータ活用と課題
お客様にデータ活用の課題についてアンケートを実施したところ、「データが分散しているためデータ統合をどのように進めたらよいかわからない」、「データ活用を始めたいが、どのように進めたらよいか分からない」という回答が多くありました。
また、データの分析・活用について相談できる人がいなかったり、複数のデータで異なる結果が出てきて解釈が難しいということもよく聞きます。
このような課題を解決するものは、TableauとSnowflakeの組み合わせであると考えています。
Tableauは、直感的な操作で非常に強力な分析が誰にでも出来るビジュアル分析プラットフォームです。製品の使い方で困ったり、相談できる相手がいないといったような時にもコミュニティが充実しているので、仲間を見つけて気軽に相談できることもTableauの強みの一つです。
Snowflakeは、次世代のフルマネージド型のクラウドネイティブ・データウェアハウスです。
複数のクラウドサービスに対応しており、ストレージとコンピュータリソースが分離しているところが特長です。従来型のデータウェアハウスの場合、処理が集中すると全体的なパフォーマンスが落ちてしまいますが、Snowflakeは、処理が集中する時に必要なリソースを動的に割り当てることができるので、パフォーマンスを気にすることなく利用できます。
Snowflake のデータウェアのサイズの割り当て画面
用途に応じたサーバーサイズの変更や、処理の多重度によって使用するクラスタ数を自動的に増減するオートスケールができるので、下図の赤い線で表されているように、あらかじめリソースを常時起動する従来型の運用をやめて、コストを最適化した環境で常にフレッシュなデータを使った分析とデータの活用を実現できます。
Snowflakeにデータを集めれば、パフォーマンスよくアクセスできるので、冒頭で話していたデータ活用の課題にあった「分散したデータを探す」といったような必要もなく、パフォーマンス改善のための物理的なマート作成も不要になります。そしてTableauは、簡単な操作で分析したり見える化ができ、ダッシュボードの共有ができますので、知りたい答えをすぐに見つけることができます。Tableau、Snowflakeのどちらも最初から高額なライセンス料が発生するわけではなく、スモールスタートすることが出来ますので、どこから始めたらいいのかわからないという悩みをお持ちの方も、この2つのソリューションで小さく始めてみてはいかがでしょうか?
Snowflakeの無償トライアルは、こちらに用意してあります。今なら30日間無料でお試しできます。
以下のリンク先フォームからお申し込みください。
第二部 BI(Tableau)/AI(Einstein Analytics)の組み合わせで実現する、真のデータ活用
<講師> Tableau Software, LLC Partner Account Manager 黒井 慶 氏
10月7日から3日間、開催しましたTableau Conferenceで、「Einstein Analytics」(アインシュタイン・アナリティクス)は、Tableau CRMとしてリブランドされることが発表されました。この内容のご紹介とTableauとSnowflakeを組み合わせることによって得られる新しい示唆、これはどういったものなのかということを紹介していきます。
1.なぜ、組織横断型のデータ活用が難しいのか?
経済産業省の2025年の崖という有名なレポートがありますが、これには、どうしてデータ活用が進まないかということが書いてあります。それは、既存システムが事業部門ごとに構築され、全社横断的なデータ活用ができない からです。
また、データ活用は、データを可視化しただけではうまくいきません。よりまして、Tableauでは、データを活用するプロセスを、こう変えていけばどうですか?という提案をしています。
従来型のデータ活用プロセスは、資料作成のために基幹システムなどからデータを抽出しますが、抽出時点からデータの鮮度が落ちていきます。このため、変更・改変をしたいときにすぐに修正することができず、最新の正しい情報で意思決定することが難しくなります。
Tableauでは、基幹システムなどのデータソースに直接つなげることによって、データを見てアクションへつなげるサイクルがとても早くなります。下記の図のようにデータ活用のプロセスを変えることで組織の壁を越えられるのではと考えています。
2.業務システムからインサイトを得る方法
昨年、Tableauはセールスフォース傘下に入りました。セールスフォースでは、「Customer360」というビジョンを持っています。これは、お客様のデジタルトランスフォーメーションをサポートする仕組みです。さまざまなテクノロジーでお客様の課題を網羅して、一元的にお客様を見て、最適な提案をするというビジョンです。
下記の図は、代表的な社内システムを5つあげています。左から説明すると、会計システム、予実管理システム、生産管理システム、問い合わせ情報を管理するシステム、営業活動情報などを管理する顧客管理システムです。
通常、それぞれの社内システムにデータを可視化する仕組みがあります。これを使うと各システムに閉じたデータを把握することはできますが、他のシステムのデータと掛け合わせることはできません。このため、CSVファイルにエクスポートし、それらを表計算ソフトで集計したりTableauで可視化したりしたものを、経営者が参照します。
ところが、前述と同じ理由でエクスポートしたファイルは鮮度が落ちている、一部の部門(図ではSales Cloudが該当)だけでリアルタイム情報が得られたとしても、経営者が見る「掛け合わせデータ」は最新のものではありません。
これを解決する方法として、Snowflakeにデータを集約し、それをTableauで分析することをお勧めします。
例えば、会計システムで売掛金が増加し、回収できていないことが分かったとすると、何が問題なのかを調べなくてはなりません。営業活動を管理しているSalesCloudを見てみますと、複数のお客様から支払いが滞っていることがわかります。さらに調べるために、問い合わせ情報を管理しているServiceCloudを見てみます。確認したところ特定の製品に問題があり、検収がされていないケースがあることがわかりました。品質に問題があるということなので、生産管理システムを確認してみます。そうすると今度は、品質問題を起こしたある部品、ロットを特定することができました。次に確認すべきは、予実管理システムです。計画値に対するプレッシャーから品質に問題がでてしまったのではないかという仮説が成り立ちます。
このようにTableauとSnowflakeで、各業務システムをつなげることによって、さまざまなデータを横ぐしにしてインサイトを得ることができます。
3.Tableau + Snowflakeで作る、データバリューチェーン
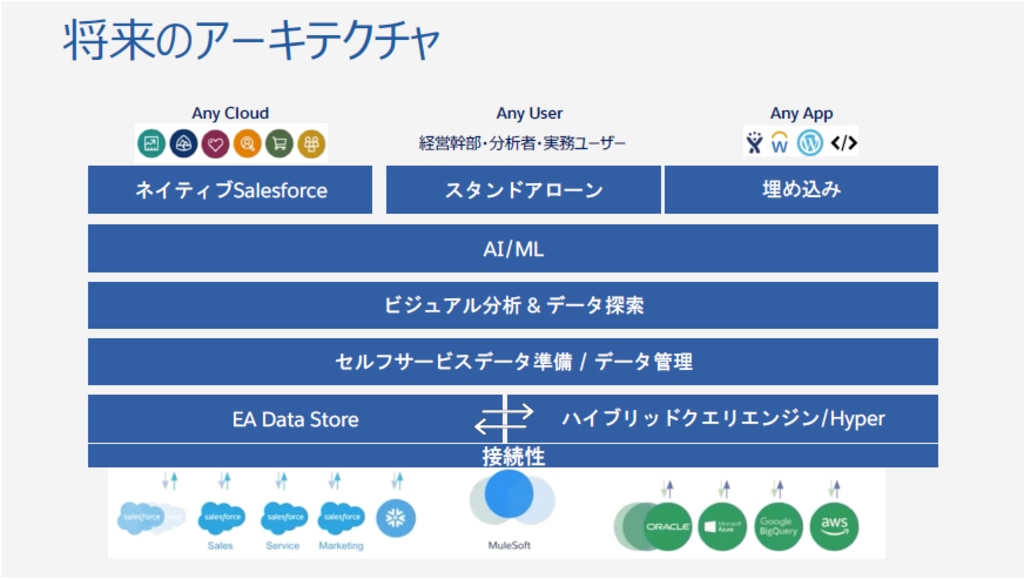
下記の図が、Tableauの新しいラインナップです。
「Einstein Analytics」(アインシュタイン・アナリティクス)は、Tableau CRMになります。
以前から利用されている方もいるかと思いますが、ブランドが変わるだけで、機能や価格も変わりませんので安心して利用いただけます。
また、Tableauのそれぞれの製品を説明します。
Tableau Prep Builder :様々なデータソースに接続し、データのクレンジング(加工、整形)を行う。
Tableau Desktop:データに接続し、ビジュアル分析を通してインサイトを得る。
Tableau Server / Online:得られたインサイトをチームで共有、上司に報告、他部門に発信する。
Tableau Catalog:Tableau管理下のデータ資産をカタログ化。検索や管理、来歴管理が容易になる。
Tableau Prep Conductor:Tableau Prep Builderの手続き(フロー)を自動化。
「Einstein Analytics」(アインシュタイン・アナリティクス)とTableauは、別製品ですが、これから統合していく方針です。まず、AI/MLとデータのレイヤーから統合・連携していきます。
最終的にすべてのレイヤーで統合していくロードマップが発表されました。
では、AI/MLとデータのレイヤーの統合の具体的なイメージとして、下記の3つの機能を挙げます。
- ダッシュボード拡張機能 (Dashboard Extensions):ダッシュボードからリアルタイム予測結果にアクセス
- 分析計算:リアルタイム予測をVizに埋め込み
- Tableau Prep:予測数値をデータセットに追加
それぞれ説明していきます。
ダッシュボード拡張機能 (Dashboard Extensions):ダッシュボードからリアルタイム予測結果にアクセス
下図の左側がTableauダッシュボード、右側がアインシュタインになっています。
右側に31%と書いてありますが、これは、出荷が遅れる可能性を示しており、その下に出荷の遅れる原因は何か?出荷を早める要因は何か?ということが記載されています。このように様々な予測データをアインシュタインが分析した結果を表示していますので、素早く次の手を打つことができます。
分析計算(Analytics Calc):リアルタイム予測をVizに埋め込み
下図の右下に散布図がありますが、Tableauのワークシートから計算式でTableau CRMを表示させています。現在、PythonとかRなど外部関数をCallする仕組みがありますが、同じ仕組みを実装しています。
Tableau Prep:予測数値をデータセットに追加
Tableau Prep のフローに、予測モデルにデータを渡し、結果をもらう機能が追加されます。あらかじめ作っておいた予測モデルを選択できますので、予測モデルの詳細を知らなくても予測モデルの結果を組み込んだデータを準備することができます。
予測ができれば、変化への対応も楽になります。では、次にどうやって作っていけばよいのかということを紹介します。
SnowflakeにDesktopやPrepをつなげて、データを綺麗にします。そしてTableau CRMに渡し、予測データを作ります。予測データ付きのデータをTableau Online にアップロードすると、ここに過去のデータと未来のデータのデータセットができます。それを、アナリストの方々が、Tableau Desktopで分析するもよし、現場の方々がTableau Onlineに接続してみるのもよし、場合によってはSalesforce をお客様のポータルに埋め込んで、ポータルのユーザーが間接的にそのオンラインのデータを見るというシナリオです。その裏にあるデータセットの実態は、SAPやAnaplanなどのデータを収集したSnowflakeです。これをすることによって、さまざまな業務で使っているデータを横ぐしで見ることできます。
Tableau Creator とTableau CRMとSnowflakeがあれば誰でも着手出来ますので、ぜひお試しください。
第三部 データ待ち時間を0へ〜分析のフローを止めない基盤「Data Cloud」
<講師> Snowflake株式会社 シニアセールスエンジニア KT 氏
第三部はSnowflakeのセッションです。Snowflakeはどんなことができる製品で、何を目指してこの市場に登場したのかを紹介していきます。
前のセッションでTableauの紹介もあったのと、私も2020年5月まではTableauの社員だったこともあり、Snowflakeの話をする前に、Tableauが提唱している「人がどうやってデータを理解するか」のステップを図解した【ビジュアル分析のサイクル】の図を紹介します。人がデータを活用する時の姿をシンプルに表した図になっています。
データを使って売上や利益を向上したい、コスト削減したい、などいろいろなタスクがあります。そのタスクを解決するために、どんなデータを取得するか、どんなグラフで表現するかを考え、最終的には誰かに共有して、アクションを促していきます。これらの動作にいちいち時間がかかって遅いようではいけません。待っている時間は私たちの思考のフローを途切れさせてしまうのです。ですから、この1つ1つのステップをいかに待たずに素早く行えるかが非常に大切なのです。
ある日突然激変した世界の中で、ある事に気付く
新型コロナウイルス感染拡大の影響で、日本では2020年4月は緊急事態宣言が発出され、たくさんの人が家に留まることを余儀なくされました。世界ではロックダウンの施策がとられ、世界中の人の外出は大きく制限されました。しかし家にこもっていたら、外の様子は分からず、感染が拡大している実感は湧きません。ではどうしたらよいのか? その答えを得るため、私たちは目に見えないものをデータを使って解き明かそうとしました。Tableau Publicには、コロナウイルスに関連するレポートを有志の人たちがたくさんアップしています。世界中の人がこの状況をなんとかできないか、私たちの力で何とかできないか、ということで、こういった努力をいろんな方がされていました。しかし、一方でこれらの分かりやすいビジュアリゼーションの裏側は、表には見えない地道で根気のいる努力がありました。
コロナウイルスの感染者情報は、データの集計方法が突然変わったりするので、毎日のように手を加えながら、集計をしていました。保健所の方は、本来的には、感染者の情報をデータ化することが仕事ではありません。もしデータが自動的に記録されていたら、どんなに違ったことになっていたことでしょう。しかし残念ながら、かなりの分量が手作業で集計、送信されていました。その結果、本来の検査という仕事を圧迫していたことでしょう。データを集める行為自体が本来やるべき仕事の邪魔をしてしまうことになったのです。
従って、私たちの世界でデータを使っていろんなことを知ることができる状況だったかというと、まだデータ=世界には程遠いものでした。Tableau的に言うとGetするDataがなかったわけです。データを持ってきたり、取りに行くのは非常に簡単にできます。しかし、取ろうと思うそのデータが、そもそも存在していない、という大きな課題に気づきました。
Our Mission:Enable every organization to be data-driven すべての組織をデータドリブンへ
私たちは存在しているだけで、生きている限り日常的にデータを生成しています。
Webサイトを閲覧する、システムにログインする、FacebookなどのSNSに書き込み「いいね」を押す、アンケートを送信する、などデータを生成していることを意識しないままに動作しています。とにかく生きていると、様々なデータを生成しています。そのデータが、どのように使われているのかを、意識していないケースが多く見受けられます。生まれたことにすら気付かれないデータは、気付かない内にデータについて熟知したごくわずかな企業にいつの間にか保管され、自分のものであったことすら忘れ去られ、勝手に利用され始めていくのです。自分たちが生成したデータは、自分のものであるという意識を持っていなければなりません。今、世界は大きな分岐路に立たされています。自分のデータを自分で管理し、活用して、データの持ち主の意志と尊厳を尊重しながら、倫理的にビジネスバリューを上げていくことのできる組織や個人により、世界的にデータドリブンが進んでいくのか、あるいはごく限られたデータを扱うことに長けた組織にデータを搾取され、それ以外の組織に所属する人たちは自分ではデータ活用ができず、限られた人たちのみがデータの恩恵を受ける格差社会に突入していくのかという、大きな分岐点です。
データを使った様々な可能性は、すべての組織のためにあるのではないでしょうか。ごく一部の人のためのデータではなく、すべての人がデータを使えるような場所を作りたい。今そうなっていないのは、データ活用が難しすぎるからです。ですから私たちはすべての組織をデータドリブンにするために、どんな人でも簡単にデータを扱うことができるようSnowflakeを作りました。
すべての組織を支えるデータクラウド
私たちはすべての組織が使えるデータクラウドを提供しています。これはデータが綺麗であろうが、整備されていなかろうが、量が多かろうが、使う人が何人いようが、どんなシチュエーションにおいてもカバーできる場所のことです。そのデータクラウドに、皆さんのデータを一箇所に集めることができ、メンテナンスを極限まで削減することができれば、データの管理は格段に容易になります。データの管理に頭を悩ますことがなくなった人たち同士が一緒にコラボレーションできるような世界を目指しています。
そもそも、なぜデータは使いたいときに使えないのか?それには、次の3つの課題があります。
大きな3つの課題
1.データの出自
データの生まれる場所が異なれば、形や量も異なり、素早く処理する能力と工夫が必要になる。
2.サイロ化
データはそもそも生成される場所が異なるためサイロ化しやすい。また一度データ統合した後もパフォーマンスを理由にデータマート化されたりして再度サイロ化が進むケースもある。
3.共有のハードル
データを他の組織に共有する場合、データを複製して送信する必要がある。一度保護したはずのデータを再度別の場所に送信する場合、データの置き場所や通信方法についてのセキュリティーの設定を再度検討しなければならない。重たいデータの送信や、更新頻度の高いデータ連携には莫大なコストがかかる。
各所に散らばったデータを柔軟に処理するには、莫大なハードウェアリソースがあればいいと考えられてきました。ですから、上記の課題については、巨大なリソースであっても即座に使うことができるクラウドが解決してくれると考えられていました。しかしそれはうまくいきませんでした。なぜなら、既存のクラウドは次の2通りしかなかったからです。
・アプリケーションクラウド
例えば、セールスフォースなどになります。
・インフラストラクチャークラウド
例えば、AWSやAzureなどになります。
結局、現状のクラウドの環境だけでは、データを見ることが難しい状態です。データを閲覧するためにはアプリケーションから生成したデータを統合し、計算させる複雑なステップがあります。処理する場所をただクラウド環境に持っていただけではクラウドのリソースを効率よく使えないというのが、私たちの問題提起でした。私たちは、この難解さをなるべく簡単にシンプルにしていきたいと考えています。データがどこにあっても、誰でも使えるようにするために、アプリケーションクラウドとインフラストラクチャークラウドの間にデータクラウドとしてクッションのように存在している状態を目指しています。そのためには、データを格納する場所が、どこであっても連携できるよう、マルチクラウドであり、マルチリージョンであることが非常に重要だと考えています。
データクラウドを支えるアーキテクチャー
ストレージは一箇所に統合され、それに対してコンピューターリソースを個別に付けていくことができる形となっています。格納しているデータに対してアクセスするコンピュータリソースは、何個でも作ることができます。それでも一箇所に統合されたデータにたくさんのコンピューターリソースが同時にどれだけアクセスしても全く競合しないというのがSnowflakeのアーキテクチャーです。
データの量が、最初は少ししかなく、途中でどんどん増えていったときにも対応できます。ウェアハウスのサイズを上げていくと、処理時間はどんどん短くなります。コストは、稼働した時間×性能です。例えば、XSサイズで16分かかる処理をXLサイズで1分で処理できたならば金額は同じです。同じ金額で16分の1のスピードを出せるのならば、早い方を選択するべきでしょう。
普段は、セキュリティーで守られているが、データの一部分だけ外に公開したい、このデータはある人にだけ貸してあげたい、ということもできるのが Snowflake です。自分のデータを1カ所に保存して、どこにもコピーしないままに、別のユーザーがその人が所持しているウェアハウスを使って、みなさんのデータにアクセスすることができる。これがデータシェアリング機能になっています。この機能を活用してデータプロバイダーが自分たちのデータをまるでマーケットに並べて出店しているかのようなデータマーケットプレイスもあります。新型コロナウイルスに関するリアルタイムの情報などは、データマーケットプレイス上で無償公開され、世界中の調査機関や医療、製薬業、政府などに活用されています。ウェアハウスがいくつアクセスしてきても良いからこそ実現できる画期的なデータ共有の方法です。
このような機能やビジョンが評価され、現在3000を超えるお客様のデータ基盤としてSnowflakeを使っていただいています。
皆様が自分の意思で、個々人が最もクリエイティブな発想のできる環境を用意し、すべての組織がデータドリブンな世界になる、そういう道を皆様と一緒に歩んでいきたいと考えています。
まとめ
セルフサービスBIという言葉をよく聞く機会がありますが、そのセルフサービスBIを牽引してきた製品は、Tableauではないでしょうか。また、データを用意しておく場所として最適なものとしては、クラウド型でベンダーの垣根を超えるSnowflakeではないでしょうか。データを自由に活用するために必要な製品としては、最適な組み合わせです。両製品を組み合わせてデータドリブンな経営をスモールスタートさせましょう。気になった方は、こちらまでご連絡ください。


0 コメント:
コメントを投稿